Visualizing PyTorch memory usage over time
Memory snapshots are a way to dump and visualize the state of CUDA memory allocation in PyTorch. They are useful for debugging out of memory (OOM) errors by showing stack traces for allocated memory and how the allocated memory fits in the caches used by the caching allocator.
Memory traces supplement snapshot information with trace events related to memory allocation. They show the series of allocation events that led up to an OOM error and can be used to generate visualizations of memory usage over time.
Generating Memory Snapshots with Traces
Like snapshots, we have to enable memory recording:
torch.cuda.memory._record_memory_history(
        # keep a maximum 100,000 alloc/free events from before the snapshot
        max_entries=100000)
We limit the total size of the trace event buffer to trace_alloc_max_entries before a snapshot is taken, but the facility can easily record hundreds of thousands of events. Recording these traces is pretty fast (~1us per allocation, a normal PyTorch kernel call takes at least 8 us), and adds almost no extra time on top of recording memory snapshots.
As an example, we can take a snapshot of a training iteration for a resnet:
from torchvision.models import resnet18
from pprint import pprint

model = resnet18().cuda()
criterion = torch.nn.CrossEntropyLoss()
optimizer = torch.optim.SGD(model.parameters(), lr=0.001, momentum=0.9)

input = torch.rand(8, 3, 224, 224, device='cuda')
labels = torch.zeros(8, dtype=torch.long, device='cuda')

model.train()

outputs = model(input)
loss = criterion(outputs, labels)
loss.backward()
optimizer.step()

snapshot = torch.cuda.memory._snapshot()
pprint(snapshot['device_traces'][0])
There is one trace per device, and each trace looks like:
[{'action': 'segment_alloc',
'addr': 139934079909888,
'frames': [{'filename': '/raid/zdevito/pytorch/torch/nn/modules/module.py',
            'line': 890,
            'name': '<lambda>'},
            {'filename': '/raid/zdevito/pytorch/torch/nn/modules/module.py',
            'line': 805,
            'name': '_apply'},
            ...],
'size': 2097152,
'stream': 0},
{'action': 'alloc',
'addr': 139934079909888,
'frames': [{'filename': '/raid/zdevito/pytorch/torch/nn/modules/module.py',
            'line': 890,
            'name': '<lambda>'},
            {'filename': '/raid/zdevito/pytorch/torch/nn/modules/module.py',
            'line': 805,
            'name': '_apply'},
            ...],
'size': 37632,
'stream': 0},
...]
Device traces are a list of TraceEntry dictionaries with this structure:
from typing import TypedDict, List

class TraceEntry(TypedDict):
    action: str # one of
    #'alloc', memory allocated
    #'free_requested', the allocated received a call to free memory
    #'free_completed', the memory that was requested to be freed is now
    #                   able to be used in future allocation calls
    #'segment_alloc', the caching allocator ask cudaMalloc for more memory
    #                 and added it as a segment in its cache
    #'segment_free', the caching allocator called cudaFree to return memory
    #                to cuda possibly trying free up memory to
    #                allocate more segments or because empty_caches was called
    #'oom',          the allocator threw an OOM exception. 'size' is
    #                the requested number of bytes that did not succeed
    #'snapshot'      the allocator generated a memory snapshot
    #                useful to coorelate a previously taken
    #                snapshot with this trace

    addr: int # not present for OOM
    frames: List[Frame]
    size: int
    stream: int
    device_free: int # only present for OOM, the amount of
                     # memory cuda still reports to be free


class Frame(TypedDict):
    filename: str
    line: int
    name: str


traces: List[List[TraceEntry]] = torch.cuda.memory._snapshot()['device_traces']
# one list per each device
trace_device_3: List[TraceEntry] = traces[3]
Saving snapshots
Since the traces are just part of the snapshot, they can be pickled in the same way to view offline later.
from pickle import dump
with open('snapshot.pickle', 'wb') as f:
    dump(snapshot, f)
The file _memory_viz.py can be downloaded and run independently of pytorch to view the traces textually, using the trace command:
$ wget https://raw.githubusercontent.com/pytorch/pytorch/master/torch/cuda/_memory_viz.py
$ python _memory_viz.py trace snapshot.pickle
Device 0 ----------------
291 entries
a = cudaMalloc(139838718214144, 2.0MiB)
b = a[0:36.8KiB]
c = a[37888:256.0B]
d = a[38400:256.0B]
e = a[38912:256.0B]
f = a[39424:256.0B]
g = a[39936:8.0B]
...
Visualizing traces
Visualization of this information can make it much easier to interpret. The same tool can generate interactive html plots that let you explore the allocated memory as it existed over time:
$ python _memory_viz.py trace_plot snapshot.pickle -o trace.html
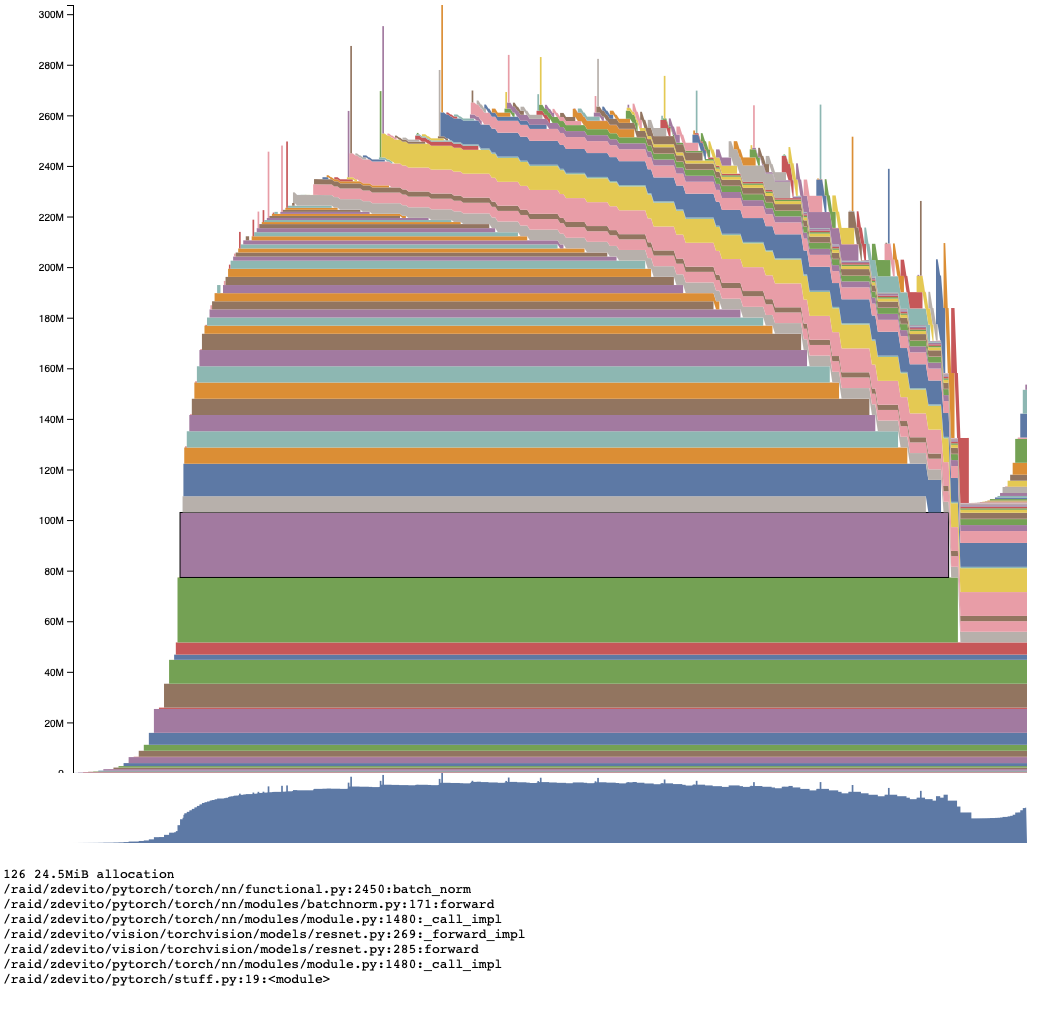
The visualization plots the total amount of memory allocated on the Y axis, with memory events over time on the X axis. Interactive view here:
Brushing over individual allocations provides the stack trace where they were allocated.
The visualization makes patterns in memory clear. The forward pass accumulates activations waiting for their use in the backward pass. As the backward pass starts, those saved activations start to be freed step-by-step as gradient tensors are allocated. The leads to the common pattern where max memory usage occurs somewhere early in the backward pass. Th optimizer step, which allocates its own temporaries, is visible at the end.
Another interesting pattern is the spikes in usage. Looking at the forward pass with stack information reveals they are part of the _conv_forward operator and are likely the temporary buffers allocated to perform the fastest convolution type in CUDNN. One common pattern to see when near maximum memory usage is for CUDNN to run out of memory, try a different algorithm, and then succeed. This visualization makes it clear this happens because these spikes hit the memory max first.
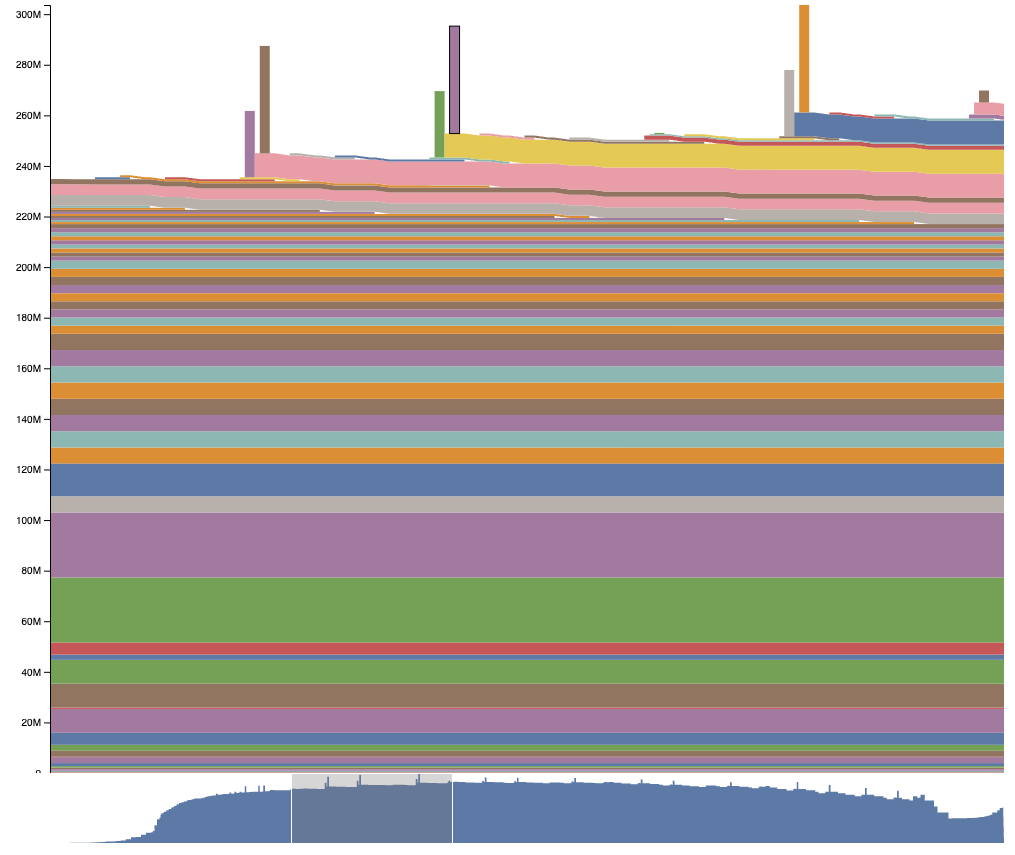
The chart also allows panning and zooming using the minimap or dragging the chart around, where we can zoom into one of these spikes in memory usage in the backward pass:
Generating Traces when Out of Memory
With memory tracing turned on, it can be helpful to generate a snapshot and a trace right at the point of running out of memory by registering an observer with the allocator that will be called everytime it is about to raise an OutOfMemoryError:
def oom_observer(device, alloc, device_alloc, device_free):
    # snapshot right after an OOM happened
    print('saving allocated state during OOM')
    snapshot = torch.cuda.memory._snapshot()
    dump(snapshot, open('oom_snapshot.pickle', 'wb'))

torch._C._cuda_attach_out_of_memory_observer(oom_observer)
When running out of memory, this function may be called multiple times because as we saw with the spikes earlier convolution might run out of memory and retry with an algorithm that uses less scratch space. The last time the observer is called will hold the information from an uncaught OOM error.
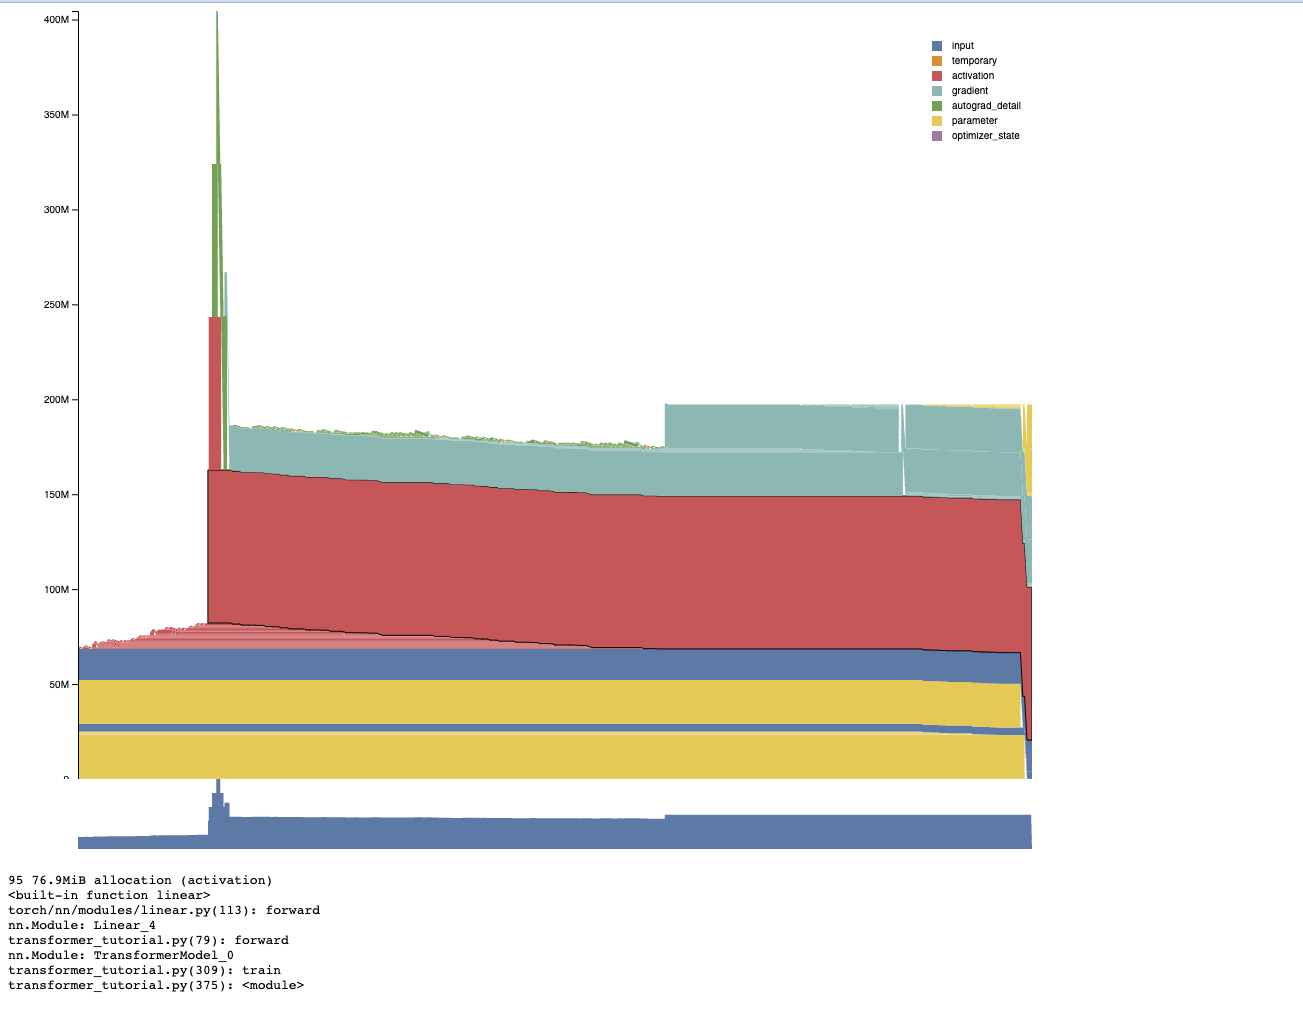
Generating Memory Visualization from torch.profiler traces
torch.profiler can also record memory usage along with additional helpful information such as the location in the module hierarchy, the category of tensor being allocated, the tensor sizes, and the set of operators used to generate the tensor. Our _memory_viz.py tools can also parse and create interactive visualization for this information as well:
    with torch.profiler.profile(
        with_stack=True,
        profile_memory=True,
        record_shapes=True
    ) as prof:
        <your code here>

    from torch.cuda._memory_viz import profile_plot
    with open('output.html', 'w') as f:
        f.write(profile_plot(prof))
This provides category and module information as well as stack traces:
Depending on circumstances, it may be easier to use profiling or memory snapshots to generate memory plots and debug usage. Memory snapshots can be generated and then plotted offline, but the profiler provides additional information such as categories that can be helpful.